MCR Diabetes & Eye Care · Kannur, Kerala
+91 9497 222 722
Glycemic Index of Indian Foods: A Practical Guide to Choosing Carbohydrates
Glycemic index (GI) charts circulate widely among Indian diabetics, often creating more confusion than clarity. A small serving of watermelon can have a modest glycaemic load despite its GI, while fat can slow the measured response to foods such as ice cream. These examples show why GI alone can mislead. Understanding why requires one extra concept — glycemic load — after which the whole system becomes genuinely useful. Our specialist team at MCR Diabetes & Eye Care, Kannur, explains how to use GI properly with Indian foods.
Evidence-based clinical note: GI ranks the glucose response to a fixed amount of available carbohydrate; it does not describe a usual serving. Glycaemic load, portion size, cooking, processing and the rest of the meal all affect the post-meal rise, so use GI charts as a guide rather than a prescription.
GI ≤55
counts as low glycemic index
GL ≤10
counts as low glycemic load per serving
Meal order
may lower the post-meal rise
Portion
matters more than variety
GI measures how quickly a carbohydrate raises blood glucose compared with pure glucose, scored from 0 to 100. It tells you about carbohydrate quality. What it does not tell you is how much carbohydrate is actually in a normal serving — which is why glycemic load exists. For the broader dietary framework, see our Indian diabetes diet chart and our Kerala foods and blood sugar guide.
GI vs Glycemic Load: The Distinction That Matters
Glycemic index compares equal amounts of carbohydrate (50 g) across foods. Glycemic load (GL) adjusts for the carbohydrate actually present in a realistic portion:
Glycemic Load = (GI × grams of carbohydrate per serving) ÷ 100
Watermelon illustrates the point. Its GI is around 72 — high. But a 120 g slice contains only about 8 g of carbohydrate, giving a glycemic load of roughly 6 — low. You would need to eat several kilograms to consume the 50 g of carbohydrate the GI test used.
- GI: Low ≤55 · Medium 56-69 · High ≥70
- GL per serving: Low ≤10 · Medium 11-19 · High ≥20
Key fact: Watermelon has a high GI of about 72 but a glycemic load of only 6 per slice — you would need to eat several kilograms to consume the carbohydrate the GI test used. This is why glycemic load, not glycemic index, is the number that matters on a real plate.
Indian Staples: GI and Glycemic Load
| Food | GI (approx.) | Typical Serving | GL |
|---|---|---|---|
| Polished white rice | 73 | 1 cup cooked | High (~29) |
| Matta / parboiled rice | 55-65 | 1 cup cooked | Medium-high (~22) |
| Basmati rice | 50-58 | 1 cup cooked | Medium (~20) |
| Ragi (finger millet) | 55-68 | 1 cup cooked | Medium (~15) |
| Bajra / jowar | 50-62 | 1 cup cooked | Medium (~14) |
| Whole wheat chapati | 52-62 | 2 medium | Medium (~18) |
| Maida (refined flour) | 70-85 | 2 rotis / 1 bun | High |
| Tapioca (kappa), boiled | 70+ | 1 cup | High (~26) |
| Rajma / chana / dal | 28-40 | 1 cup cooked | Low (~8) |
| Idli (2 pieces) | 60-70 | 2 medium | Medium (~16) |
| Dosa (1 plain) | 65-77 | 1 medium | Medium (~15) |
| Steel-cut oats | 42-55 | 1 bowl | Low-medium (~11) |
| Boiled potato | 78-82 | 1 medium | High (~22) |
What Actually Changes a Food’s GI
Processing and Particle Size
The finer the grind, the faster the digestion. Whole wheat grains have a lower GI than atta, which is lower than maida. Steel-cut oats beat rolled oats, which beat instant oats. This is why “whole grain” flour products are less protective than people assume — the flour is still flour.
Cooking Time and Method
Overcooked, mushy rice or pasta has a higher GI than firm. Longer cooking gelatinises more starch, making it more accessible to digestive enzymes.
Cooling and Resistant Starch
Cooking rice or potato, cooling it overnight, then reheating converts some starch into resistant starch, which behaves more like fibre. This can reduce the glycemic impact by 10-15%. It is one reason traditional pazhaya choru (fermented overnight rice) has a gentler effect than freshly cooked rice — although the accompanying salt and portion still need attention.
Fat, Protein, and Fibre in the Meal
All three slow gastric emptying and blunt the glucose peak. This is why ice cream scores lower than potato — its fat content slows absorption — and why it emphatically does not make ice cream a good choice. GI is one dimension of a food, not a verdict on it.
Ripeness
Green bananas have a GI around 30; fully ripe bananas around 60. The same applies to mango, papaya, and most fruit.
Acidity
Vinegar, lime, curd, and fermented foods reduce the glycemic response of a meal — one of the reasons a squeeze of lime or a bowl of curd alongside rice is more than tradition.
⚠ Important: GI charts say nothing about nutrition. Ice cream scores lower than boiled potato because its fat slows absorption — which does not make it a better choice. Use GI to choose between similar foods, never as a ranking of what is healthy.
The Four Habits That Beat Any GI Chart
1. Eat in the Right Order
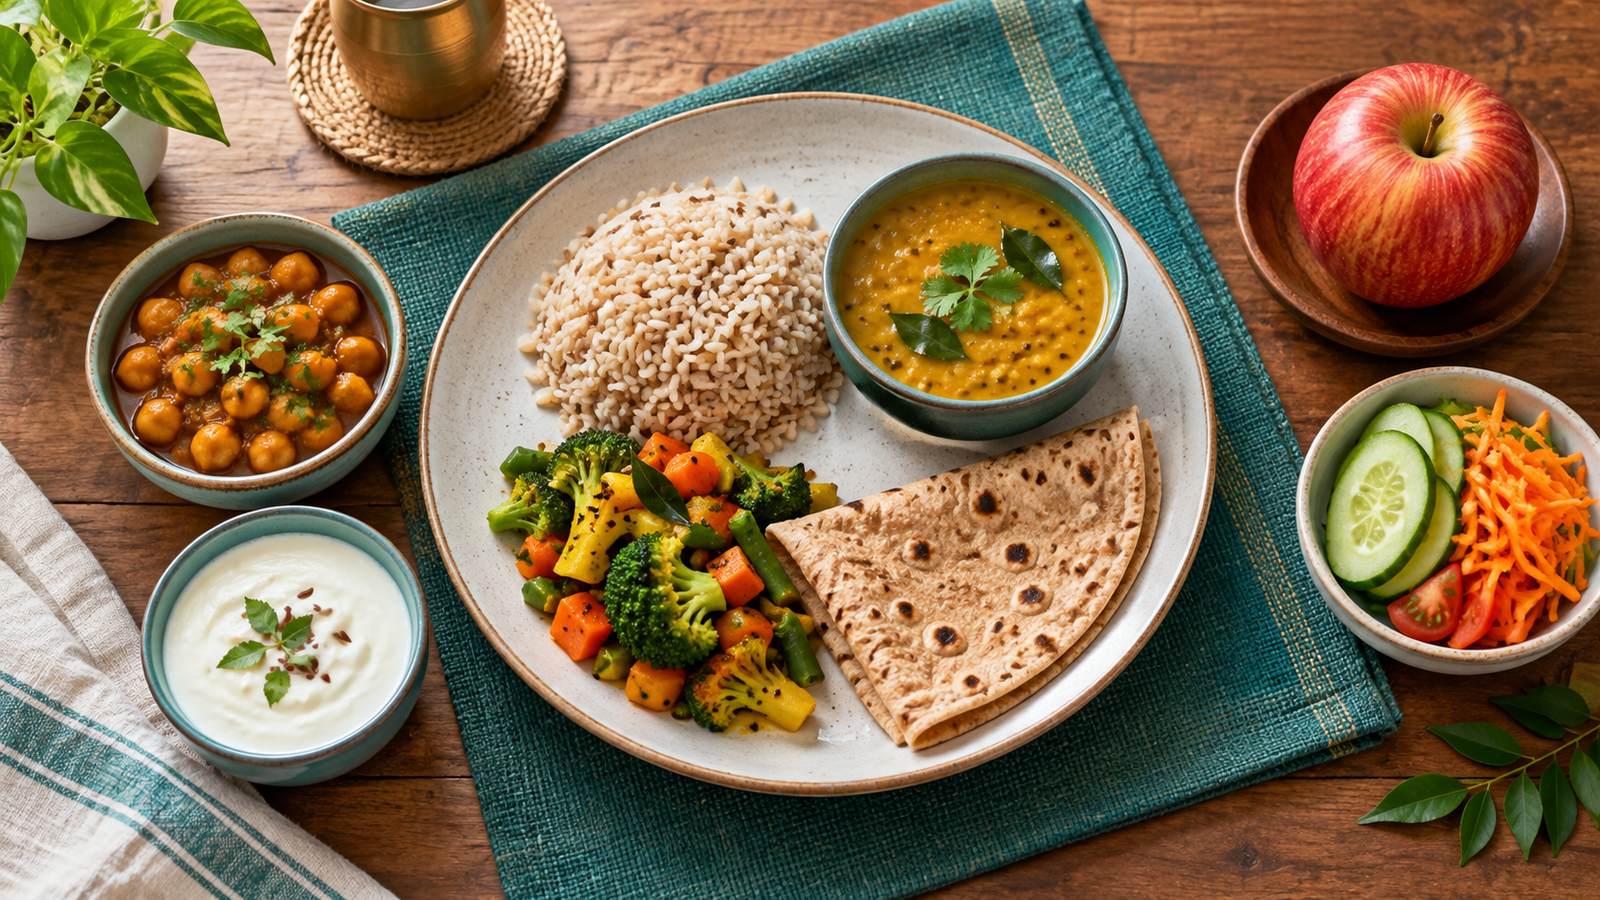
Vegetables and protein first, carbohydrate last. Eating vegetables and protein before the main carbohydrate may reduce the post-meal glucose rise for some people, but the effect varies with meal composition and individual response.
2. Control the Portion
One levelled cup of cooked rice. A heap of low-GI rice still delivers a high glycemic load.
3. Pair Every Carbohydrate
Never eat carbohydrate alone. Rice with fish curry and thoran behaves entirely differently from rice with a thin rasam.
4. Walk After Eating
Ten to fifteen minutes of walking after meals lowers the peak by 20-30 mg/dL — see our exercise guide.
Practical Swaps for Indian Kitchens
- White rice → matta rice, hand-pounded rice, or millets — and halve the portion regardless
- Maida products → whole wheat or millet flours, ideally coarse-ground
- Rice flour puttu → ragi puttu — one of the best breakfast upgrades available in Kerala
- Rice-only breakfast → add kadala curry or egg for protein anchoring
- Fruit juice → whole fruit — juicing removes fibre and multiplies the sugar per glass
- Potato → sweet potato, or better, non-starchy vegetables
- Cornflakes and instant oats → steel-cut oats, upma with millet, or dosa
- Sugary tea → unsweetened tea with roasted chana instead of fried snacks
Test Your Own Glycemic Responses
A 14-day CGM session shows exactly how your body handles your usual meals — far more useful than any published chart.
Where GI Charts Mislead
- They ignore portion. Always translate GI into glycemic load for a real serving.
- They ignore the whole meal. Foods are rarely eaten alone; the mixed meal is what matters.
- They vary between people. Individual glucose responses to identical meals differ substantially — gut bacteria, insulin sensitivity, sleep, and stress all contribute.
- They say nothing about nutrition. Many low-GI foods are highly processed and poor choices overall.
- Published values vary by variety, region, and preparation. Treat them as approximate guides, not precise numbers.
The most reliable answer for any individual is direct measurement. A fingerprick two hours after your usual meal, or a 14-day continuous glucose monitor session, shows exactly how your body responds to your food. See our guides to home blood sugar testing and CGM in India.
Fruits and Their Glycemic Load
| Fruit | GI (approx.) | Serving | GL |
|---|---|---|---|
| Guava | 12-24 | 1 medium | Very low (~4) |
| Papaya | 56-60 | 1 cup | Low (~7) |
| Apple | 36-40 | 1 medium | Low (~6) |
| Orange / mosambi | 43-48 | 1 medium | Low (~5) |
| Watermelon | 72 | 1 slice (120 g) | Low (~6) |
| Banana (small) | 48-55 | 1 small | Medium (~11) |
| Nendran banana | 55-65 | Half | Medium (~13) |
| Mango | 51-60 | Half medium | Medium (~12) |
| Ripe jackfruit (chakka) | 60-75 | 3-4 bulbs | Medium-high |
| Grapes | 45-59 | 1 small bunch | Medium (~11) |
| Dates | 42-62 | 2 pieces | Medium (~12) |
Frequently Asked Questions
Below are the questions our patients ask most often. If you have additional questions, our specialist team at MCR Diabetes & Eye Care, Kannur, is always available to help.
What is the difference between glycemic index and glycemic load?
GI compares equal amounts of carbohydrate (50 g) across foods, telling you about carbohydrate quality. Glycemic load adjusts for how much carbohydrate is actually in a normal serving. GL is the practical number.
Is matta rice really better than white rice?
Moderately, yes — more fibre and a slower release. But one cup of white rice with vegetables and fish beats two cups of matta rice eaten alone. Portion and pairing outrank variety.
Does cooling rice really lower its glycemic impact?
Cooking, cooling overnight, and reheating converts some starch into resistant starch, reducing glycemic impact by roughly 10-15%. It is a genuine effect but a modest one — helpful alongside portion control, not instead of it.
Are all low-GI foods good for diabetics?
No. Many highly processed foods have low GI because of added fat. GI is one dimension of food quality; fibre, protein, micronutrients, and processing level all matter too.
Why do two people get different readings from the same meal?
Individual glucose responses vary substantially with gut bacteria, insulin sensitivity, sleep, stress, and activity. This is why testing your own response — a fingerprick at two hours or a CGM session — beats any published chart.
Should I avoid fruit because of sugar?
No. Whole fruit comes with fibre, water, and nutrients, and most fruits have a low to medium glycemic load in normal portions. Fruit juice is the problem — it removes the fibre and concentrates the sugar.
Does adding ghee or coconut oil to rice reduce the spike?
Fat does slow gastric emptying and blunt the peak, but it also adds substantial calories. It is not a strategy for glucose control — portion size, protein pairing, and post-meal walking achieve more without the calorie cost.
Final Takeaway: A Tool, Not a Rulebook
Glycemic index is useful for choosing between similar foods — matta over polished rice, ragi over rice flour, whole fruit over juice. It becomes counterproductive when treated as a moral ranking of foods or when portion size is ignored. Combine sensible GI-informed choices with portion control, meal sequencing, protein pairing, and post-meal walking, and you have the four habits that matter more than any chart.
At MCR Diabetes & Eye Care, Kannur, our dietary counselling translates these principles into meal plans built around what your household actually cooks. For a personalised plan — or a CGM session to test your own responses — book a consultation today.
You May Also Find Helpful
- Kerala Foods and Blood Sugar: Rice, Tapioca, Coconut
- Diabetes Diet Chart India: Foods to Control Blood Sugar
- Hidden Sugar Spikes in Everyday Foods
- Industrial Starch in Packaged Foods
Sources and Further Reading
Clinical guidance and evidence reviewed for this article:
- ICMR–National Institute of Nutrition: Dietary Guidelines for Indians 2024
- American Diabetes Association: Nutrition and positive health behaviours, Standards of Care 2026
- World Health Organization: Healthy diet
- Atkinson et al.: International tables of glycemic index and glycemic load values 2021
This article is for education and does not replace individual medical advice.